Note
Go to the end to download the full example code.
read length histograms pacbio data#
QC pacbio example
First, let us get a data set example. Note the .bam extension
from sequana import sequana_data

dataset = sequana_data("test_pacbio_subreads.bam")
Create a sequana.pacbio.BAMPacbio instance
from sequana.pacbio import PacbioSubreads

qc = PacbioSubreads(dataset)
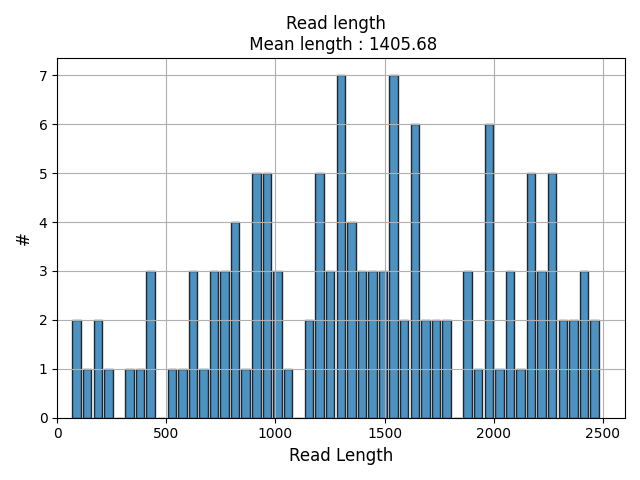
plot the histogram of read length
qc.hist_read_length()
0it [00:00, ?it/s]
130it [00:00, 20740.98it/s]
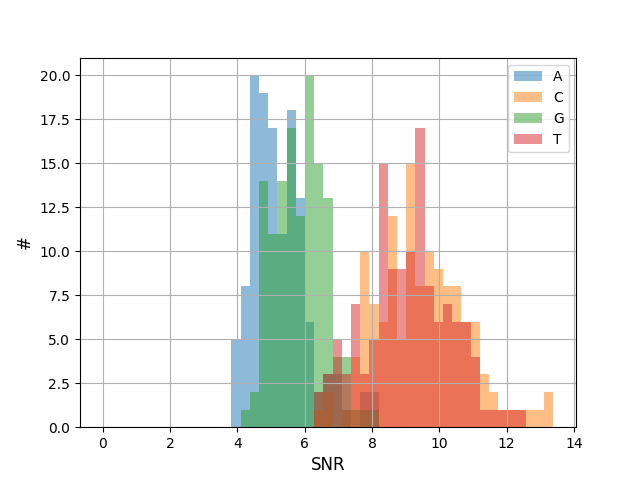
plot the histogram of the SNRs for each base
qc.hist_snr()
Total running time of the script: (0 minutes 0.367 seconds)