Note
Go to the end to download the full example code.
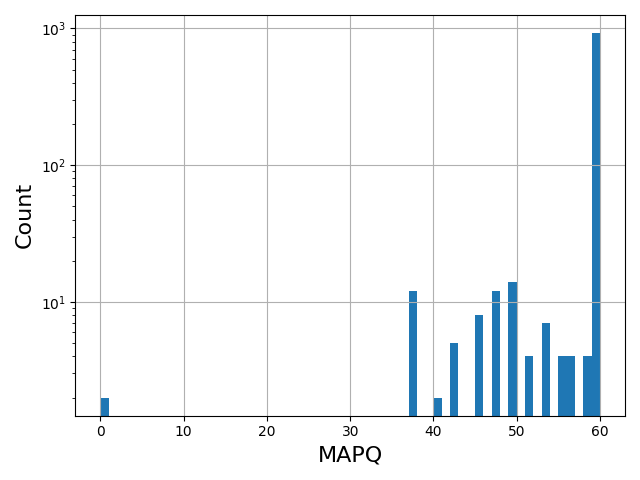
BAM module example#
Plot histogram of MAPQ values contained in a BAM file
Get a data set (BAM file) for testing#
first import the relevant modules
from sequana import BAM, sequana_data

datatest = sequana_data("test.bam", "doc")
Use sequana.bamtools.BAM class to plot the MAPQ historgram
b = BAM(datatest)
b.plot_bar_mapq()


# for some unknown reasons, we must call show in this example for this image to
# appear in the doc
from pylab import show

show()
Total running time of the script: (0 minutes 0.406 seconds)