Note
Go to the end to download the full example code.
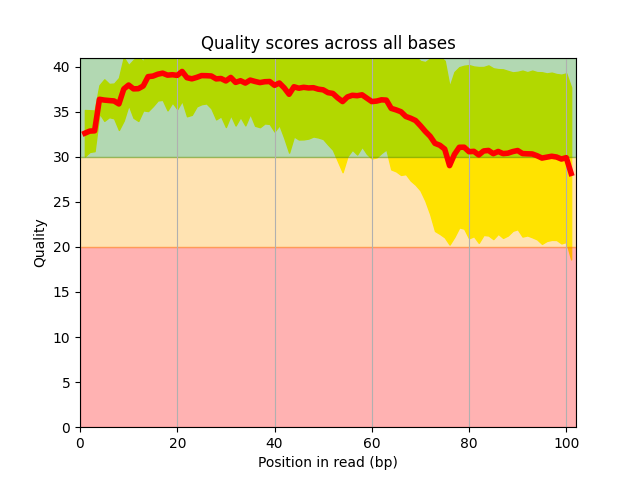
Quality histogram a la fastQC#
Get a data set example
from sequana import sequana_data

dataset = sequana_data("test.fastq.gz")
Create a FastQC instance
from sequana import FastQC

qc = FastQC(dataset, verbose=False)
plot the histogram
qc.boxplot_quality()
Total running time of the script: (0 minutes 0.220 seconds)