5.6. Pipeline statistics

First, let us get the data

from sequana_pipetools.snaketools import get_pipeline_statistics

stats = get_pipeline_statistics()
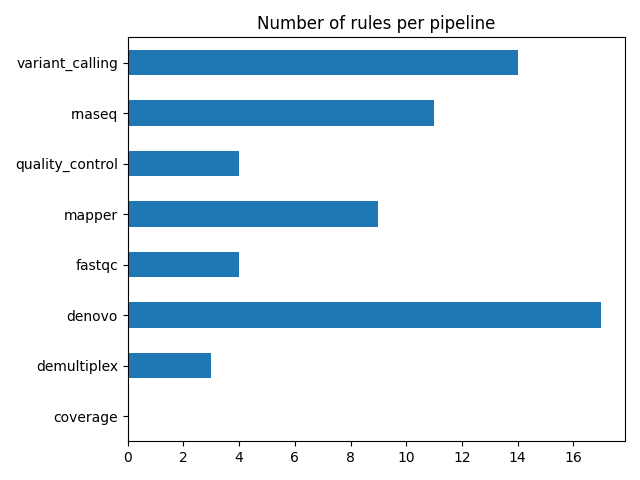
{'coverage': 3, 'demultiplex': 9, 'denovo': 24, 'fastqc': 8, 'mapper': 21, 'quality_control': 9, 'rnaseq': 33, 'variant_calling': 25}

Plot number of rules per pipeline

Note that pacbio_qc is self-content

from pylab import tight_layout, title

stats[0].sum().plot(kind="barh")
title("Number of rules per pipeline")
tight_layout()

from collections import Counter
Number of rules per pipeline

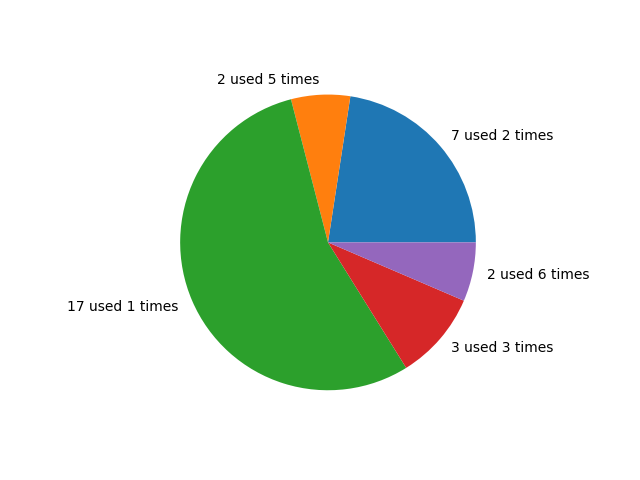
Proportions of rules re-used

Amongst the rules, about a third of the rules are not used at all in the pipelines. There are two reasons: either they were part of previous pipeline versions and were discarded in favour of new tools, or there were used for testing and kept in case of.

Then, we can see that a third of the rules are used only once. And finally, about a third used more than once.

from pylab import clf, pie

count = Counter(stats[0].sum(axis=1))
values = list(count.values())
times = list(count.keys())
clf()
pie(list(count.values()), labels=["{} used {} times".format(x, y) for x, y in zip(values, times)])
plot pipeline stats
([<matplotlib.patches.Wedge object at 0x7f57ba0aa6e0>, <matplotlib.patches.Wedge object at 0x7f57ba0d0d90>, <matplotlib.patches.Wedge object at 0x7f57ba0a99f0>, <matplotlib.patches.Wedge object at 0x7f57ba0a8190>, <matplotlib.patches.Wedge object at 0x7f57ba0a8a30>], [Text(0.8346339501101788, 0.7165097133490095, '7 used 2 times'), Text(-0.0557140326349728, 1.098588160580456, '2 used 5 times'), Text(-1.0108535980228326, -0.4337914284126575, '17 used 1 times'), Text(0.8346339501101785, -0.7165097133490098, '3 used 3 times'), Text(1.0774829367152678, -0.22142836558905993, '2 used 6 times')])

Total running time of the script: (0 minutes 0.380 seconds)

Gallery generated by Sphinx-Gallery