Note
Go to the end to download the full example code.
Kraken module example#
In Sequana, we provide tools to quickly assess the taxonomic content of a reads (FastQ). It is based on the Kraken and Krona software. Sequana bridges the gap between those tools, Kraken databases and a simple interface to get a quick taxonomic overview of the FastQ content.
For more information, please see the sequana.kraken module documentation.
The same algorithm is also exposed as a standalone CLI tool
(see sequana_taxonomy).
Although we will use the Sequana library hereafter, note that there is also a standalone application named sequana_taxonomy.
Context#
running the kraken analysis takes some time so we do provide an output directly. The output file can be analysed within Sequana to plot a Pie chart but also Javascript Krona results The kraken format is as follows:
C   HISEQ:426:C5T65ACXX:5:2301:5633:7203    11234   203 0:2 11234:1 0:1 11234:1 0:2 11234:1 0:13 11234:1 0:1 11234:1 0:3 11234:1 0:16 11234:1 0:5 11234:1 0:6 11234:1 0:13 A:31 0:33 11234:1 0:29 11234:1 0:7
C   HISEQ:426:C5T65ACXX:5:2301:5815:7120    11234   203 0:4 11234:1 0:12 11234:1 0:22 11234:1 0:1 0 11234:1 0:5 11234:1 0:7 11234:1 0:5 A:31 0:3 11234:1 0:22 11234:1 0:18 11234:1 0:24 11234:1
Each row correspond to a read in the FastQ file(s). The first column is either C (classified) or U (unclassified) and the third column contains the taxon the most relevant.
The taxon are not readable so we first need to get the scientific names
Besides, the lineage would be useful. This is done in Sequana using
the sequana.kraken.KrakenResults. See following example.
Example#
In the following example, we use the results of a kraken analysis. The original toy data files contains 1500 reads mostly related to Measles virus
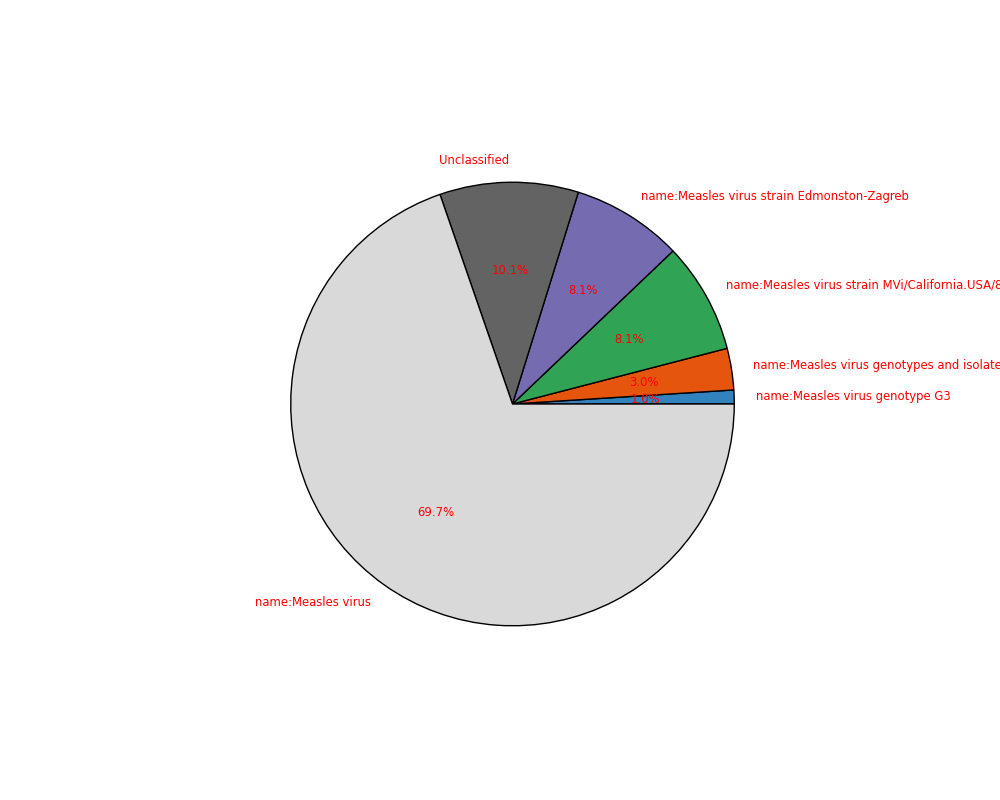
name:Measles virus genotype G3                        1.010101
name:Measles virus genotypes and isolates             3.030303
name:Measles virus strain MVi/California.USA/8.04     8.080808
name:Measles virus strain Edmonston-Zagreb            8.080808
Unclassified                                         10.101010
name:Measles virus                                   69.696970
dtype: float64
Note that only a subset of taxons are shown in the pie chart that is those that cover at least 1% of the total reads. Others are put together and labelled "others"
A more interactive plot can be obtained using Krona if installed:
An example is available in Krona example
Total running time of the script: (0 minutes 0.138 seconds)